Investing in financial markets has always been a delicate balance between fear and greed. Emotions often dictate market movements, sometimes leading to irrational decisions. One tool that aims to quantify these emotions is the Fear and Greed Index. Over the past 3 years, this index has provided crucial insights into the psychology of investors and the overall sentiment driving the markets. In this article, we’ll explore the journey of the Fear and Greed Index over the past three years and uncover must-see insights for anyone looking to make informed investment decisions.
What is the Fear and Greed Index?
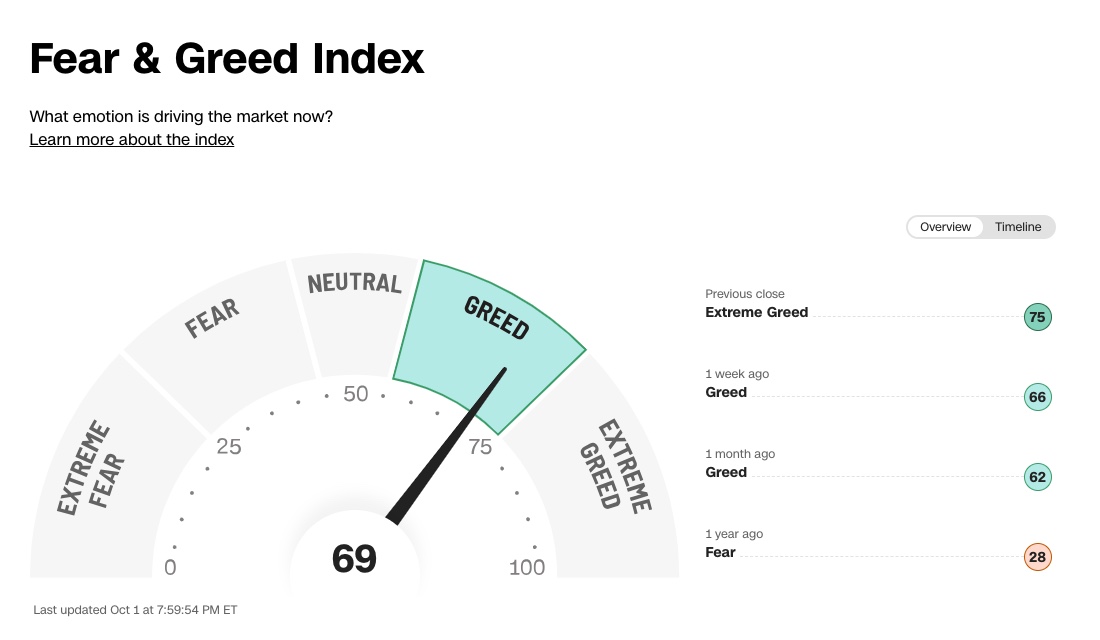
The Fear and Greed Index is a metric designed to gauge the overall sentiment in the stock market. Developed by CNNMoney, the index measures seven different factors that influence the mood of investors. These include stock price momentum, market volatility, and the demand for safe-haven assets like bonds.
How Does It Work?
Each of the seven factors used in the index is measured on a scale of 0 to 100. A score of 0 represents extreme fear, while a score of 100 indicates extreme greed. The final score is an aggregate of all these factors, providing a snapshot of the current market sentiment.
Importance in Market Sentiment
The Fear and Greed Index plays a vital role in helping investors understand market sentiment. When fear dominates the market, prices tend to fall as investors sell off assets. Conversely, when greed takes over, markets can soar as investors become overly optimistic. By tracking this index, investors can better gauge when the market is irrationally optimistic or pessimistic, allowing them to make more informed decisions.
The 3-Year Overview
Looking back over the past three years, the Fear and Greed Index has captured some of the most critical turning points in market sentiment. From the highs of bull markets to the devastating lows during periods of economic uncertainty, this index offers a unique window into how emotions have shaped the financial landscape.
Historical Perspective
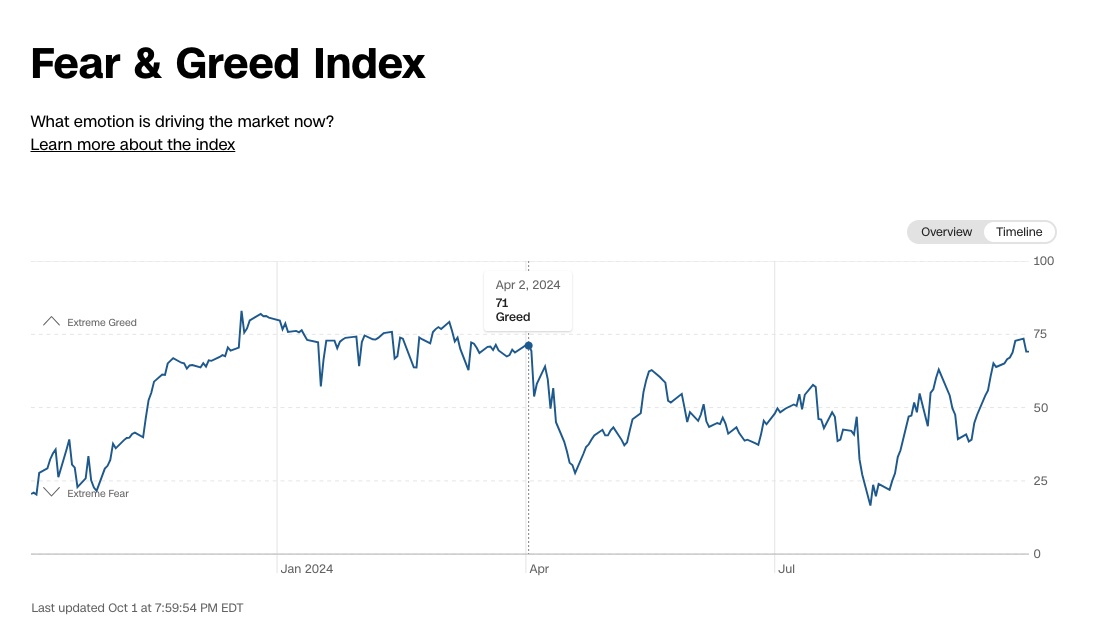
Evolution of Fear and Greed Index
Since its creation, the Fear and Greed Index has evolved to become one of the most trusted indicators for gauging market sentiment. Originally designed as a simple tool, it has grown in complexity, incorporating more factors and providing deeper insights into investor psychology.
Impact on Global Financial Markets
The Fear and Greed Index is not limited to the US market; it has a profound impact on global financial markets. Whether in Kathmandu, Bhaktapur, or Lalitpur, the emotions driving investment decisions remain universal. By tracking the index, investors around the world can gain a better understanding of global sentiment, helping them navigate volatile markets.
The Role of Emotions in Investing
Emotions have always played a crucial role in investing. Fear often leads to panic selling, while greed can result in buying at inflated prices. The Fear and Greed Index quantifies these emotions, making it easier for investors to recognize when they are being driven by emotions rather than logic.
Components of the Fear and Greed Index
Market Volatility
Volatility is one of the key factors used in the Fear and Greed Index. It measures how much the market’s price fluctuates over a certain period. Higher volatility often signals fear, as investors become uncertain about future market direction.
Stock Price Momentum
Another critical component is stock price momentum. When stock prices are rising steadily, it often reflects growing greed among investors. Conversely, falling prices can be a sign of increasing fear.
Market Breadth
Market breadth refers to the number of stocks advancing versus those declining. A higher number of advancing stocks typically indicates greed, while a majority of declining stocks suggests fear.
Safe-Haven Demand
When investors flock to safe-haven assets like bonds, it often signals fear. This demand is one of the components of the Fear and Greed Index, as it shows a shift away from risky assets toward safer investments.
Junk Bond Demand
The demand for junk bonds, or high-yield debt, is another factor in the index. When investors are willing to take on more risk by buying junk bonds, it indicates greed. However, when demand falls, fear is likely taking hold.
Put and Call Options
Options trading is a powerful indicator of market sentiment. When there is an increase in the buying of put options, which protect against market declines, it signals fear. On the other hand, more call options, which benefit from rising markets, indicate greed.
Fear and Greed in Different Market Phases

The stock market is never static. It moves in cycles, driven by a complex interplay of emotions, economic data, and geopolitical events. The Fear and Greed Index captures these shifts, reflecting the collective mood of investors. Whether in bull markets or bear markets, understanding how fear and greed manifest in different phases can provide a vital edge for savvy investors.
Bull Markets and Greed
In a bull market, optimism often reigns supreme. Stock prices are rising, investors feel confident, and the sense of possibility seems limitless. This is when greed starts to take over. Fueled by the desire to maximize returns, investors may begin to overlook risks, convinced that the market will continue climbing indefinitely. The Fear and Greed Index during these periods often shows extreme greed, with high readings driven by factors like soaring stock prices, increased demand for junk bonds, and reduced demand for safe-haven assets.
The problem is, when greed dominates, rationality can fade away. Investors may chase after high-priced stocks, convinced that the upward trend will never end. But as history shows, extreme greed often precedes market corrections. The tech bubble of the early 2000s and the housing bubble of 2008 are prime examples of what can happen when greed becomes too pervasive.
Bear Markets and Fear
On the flip side, bear markets are the domain of fear. As stock prices plummet and economic indicators turn negative, investors become gripped by anxiety. Fearful of losing more money, many sell their investments at a loss, further driving prices down. In this phase, the Fear and Greed Index shows extreme fear, with low readings triggered by falling stock prices, soaring volatility, and a rush to safe-haven assets like bonds. Fear, like greed, can cloud judgment.
In a panic, investors may sell high-quality assets, abandoning long-term strategies out of fear of further losses. But seasoned investors know that bear markets can also present incredible buying opportunities. By recognizing when fear has taken hold of the market, investors can find value in oversold stocks and make strategic moves that pay off in the long term.
Historical Case Studies
Looking at the past decade, there have been several key moments where the Fear and Greed Index captured the extreme emotions of the market. For instance, during the COVID-19 pandemic, the index plummeted to levels of extreme fear as global markets crashed in response to uncertainty.
However, as governments introduced stimulus measures and hope for recovery grew, the index quickly swung back towards greed. Another notable example is the 2017 Bitcoin surge, where greed dominated as cryptocurrency prices skyrocketed. Investors piled in, hoping to ride the wave of unprecedented gains. The extreme greed indicated by the index during this time eventually led to a market correction, reminding investors of the cyclical nature of markets.
Fear and Greed Index Data
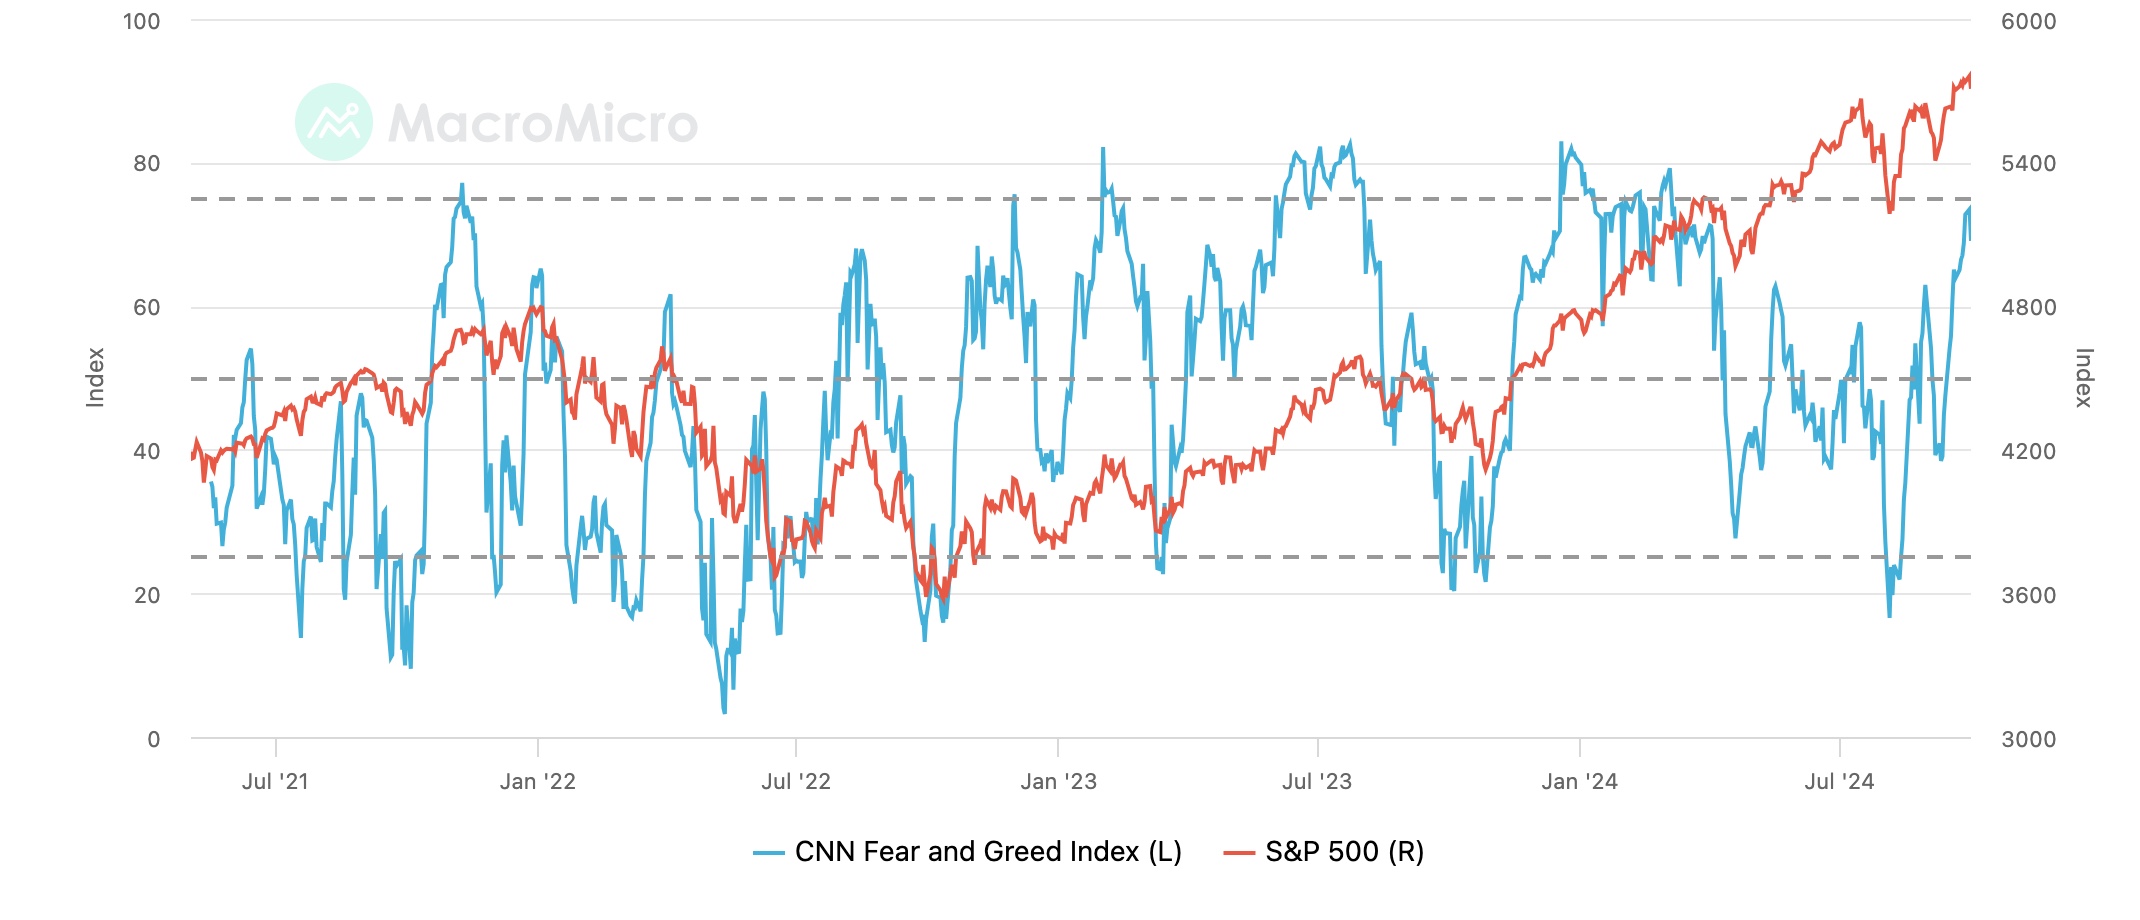
The past decade has been a rollercoaster for global financial markets, and the Fear and Greed Index has been there, documenting every twist and turn. From periods of overwhelming fear to moments of euphoric greed, the index offers a compelling story of how investor emotions have shaped the markets.
Key Trends and Patterns
Looking at the Fear and Greed Index over the last 3 years, one thing becomes abundantly clear: markets are cyclical, and emotions are often at the heart of those cycles. When fear dominates, market participants tend to sell off riskier assets, leading to declines. Conversely, during times of greed, investors are more willing to take on risk, driving prices higher. The index swings between these two extremes, providing valuable insight into the broader market sentiment.
One striking trend is how quickly the index can move from one extreme to the other. Take, for example, the COVID-19 pandemic. In a matter of weeks, the index plunged into extreme fear as uncertainty about the virus and its economic impact gripped the world. But just as quickly, it rebounded towards greed as central banks and governments stepped in with stimulus measures, giving investors newfound hope.
Milestones and Turning Points
There have been several critical turning points captured by the index over the last decade. 2012, for instance, marked a period of extreme fear as the Eurozone crisis threatened the stability of global markets. The index reflected the anxiety that dominated investor sentiment during that time. Fast forward to 2017, and the index was showing extreme greed during the cryptocurrency boom, as investors poured into Bitcoin and other digital assets, believing prices could only go up.
In 2020, the world saw one of the most dramatic shifts in the index’s history. The initial crash caused by COVID-19 sent the index to record lows, reflecting deep fear. But within months, thanks to unprecedented stimulus and a strong stock market rebound, the index swung back to extreme greed, highlighting just how reactive market sentiment can be.
Major Crashes and Recoveries
Over the last decade, the Fear and Greed Index has also been a crucial indicator during major market crashes and recoveries. For instance, during the 2008 financial crisis, extreme fear gripped the market, causing a massive sell-off. The index, though not as widely used at the time, would have signaled to savvy investors that panic was at its peak — often the best time to buy. Similarly, during the 2018 market correction, the index highlighted the growing fear among investors, which was followed by a swift recovery.
Insights from the Fear and Greed Index
What the Data Reveals
The data collected over the past 3 years reveals that investor sentiment is often reactionary, driven more by emotion than by fundamental market conditions. Fear and greed can take hold quickly, pushing markets to irrational extremes. In times of extreme fear, investors often sell off assets indiscriminately, creating opportunities for those willing to buy. Conversely, during periods of extreme greed, investors may pile into overvalued assets, setting the stage for a correction.
How to Use the Index in Investing
For investors, the Fear and Greed Index is an invaluable tool. By understanding where the market sentiment stands, you can avoid making impulsive decisions based on fear or greed. When the index shows extreme fear, it may be a good time to consider buying quality assets at a discount. On the flip side, when the index shows extreme greed, it might be wise to exercise caution and take profits before the bubble bursts.
Long-Term vs Short-Term Strategies
The index can be useful for both long-term and short-term investors. For long-term investors, the Fear and Greed Index can help identify opportunities when the market is overly fearful. Meanwhile, short-term traders can use the index to gauge whether sentiment is reaching extreme levels, signaling a potential reversal. By keeping an eye on this index, investors can adjust their strategies accordingly, whether they are looking for long-term growth or short-term gains.
Fear and Greed in Major Financial Markets
US Stock Market
The US stock market is the primary driver behind the Fear and Greed Index, as it captures sentiment across a range of American financial assets. Over the last decade, we’ve seen the index swing dramatically during key moments, such as the 2013 taper tantrum, the 2016 US presidential election, and the 2020 pandemic crash. Each of these events brought a surge of either fear or greed, which reflected the uncertainty or optimism that permeated the markets at the time.
European Markets
In Europe, the Fear and Greed Index is equally relevant. The Eurozone debt crisis in the early 2010s led to a prolonged period of fear, which kept markets depressed for several years. However, as confidence in European recovery grew, the index began to shift towards greed, especially as central banks intervened to support struggling economies.
Emerging Markets
In emerging markets, fear and greed can be even more pronounced due to higher volatility and political instability. Countries like Nepal, Bhaktapur, and Kathmandu have experienced fluctuating sentiment as their economies grow but remain vulnerable to external shocks. The Fear and Greed Index is a useful tool for tracking these shifts, as investor sentiment can change rapidly in response to global economic trends.
The Psychology Behind the Index
Understanding Investor Behavior
At the heart of the Fear and Greed Index is investor psychology. Humans are emotional creatures, and we are often driven by fear or greed when making decisions. The index serves as a mirror, reflecting the emotions that dominate the market at any given time. Understanding this psychology is critical for investors who want to avoid being swept up in the emotional tides of the market.
Cognitive Biases in Investing
The Fear and Greed Index also sheds light on the cognitive biases that influence investing. For example, during times of extreme greed, investors may fall victim to confirmation bias, only seeking out information that supports their belief that the market will keep rising. On the other hand, during times of fear, loss aversion can take over, causing investors to sell off assets to avoid further losses, even if those assets are fundamentally sound.
Fear vs Greed: A Behavioral Analysis
Fear and greed represent two sides of the same coin. Both emotions can lead to irrational decisions, whether it’s buying into a bubble driven by greed or selling in a panic fueled by fear. By recognizing these emotional triggers, investors can take a step back and make more rational decisions. The Fear and Greed Index helps you recognize when these emotions are at play, allowing you to make more objective investment choices.
Practical Use of the Fear and Greed Index
Risk Management
One of the most practical uses of the Fear and Greed Index is in managing risk. When the index signals extreme greed, it may be a good time to rebalance your portfolio and reduce exposure to risky assets. Conversely, when extreme fear takes hold, it might be time to increase exposure to undervalued assets. Using the index as a guide, investors can adjust their risk levels accordingly, ensuring they are neither too exposed during times of greed nor too conservative during times of fear.
Timing Market Entries and Exits
For those looking to time their market entries and exits, the Fear and Greed Index can provide valuable insights. While it’s nearly impossible to time the market perfectly, the index can give you a sense of whether sentiment is overextended in one direction. If the market is showing extreme greed, it may be time to take profits. If fear dominates, it could be the right moment to buy.
Portfolio Diversification
The Fear and Greed Index can also be a helpful tool in maintaining a well-diversified portfolio. By tracking sentiment, you can identify when certain sectors or asset classes may be overbought or oversold. This allows you to rebalance your portfolio to ensure you’re not overly concentrated in areas that may be driven by irrational sentiment.
How to Read the Fear and Greed Index
Key Indicators Explained
The Fear and Greed Index is made up of several key indicators, each measuring a different aspect of market sentiment. These include.
- Stock Price Momentum: Tracks whether stock prices are rising or falling.
- Market Volatility: Measures the level of uncertainty in the market, often through the VIX (volatility index).
- Market Breadth: Assesses the number of stocks advancing versus those declining.
- Safe-Haven Demand: Reflects the demand for assets like bonds that are considered safe during times of uncertainty.
- Junk Bond Demand: Measures the appetite for high-risk, high-reward investments.
- Put and Call Options: Tracks whether investors are buying more puts (indicating fear) or calls (indicating greed).
Interpreting the Scores
The Fear and Greed Index is scored on a scale from 0 to 100, with 0 indicating extreme fear and 100 representing extreme greed. A score below 25 suggests that the market is in a state of fear, while a score above 75 indicates that greed is dominating. Scores in between represent more neutral market sentiment.
FAQs
Q. How accurate is the Fear and Greed Index?
A. The Fear and Greed Index is a reliable tool for gauging market sentiment, but it should not be used in isolation. It provides a snapshot of emotions in the market, but other fundamental and technical factors should also be considered.
Q. Can the Fear and Greed Index predict market crashes?
A. While the index can indicate when the market is overbought or oversold, it cannot predict crashes with certainty. However, extreme readings often precede market corrections, making it a useful tool for managing risk.
Q. How often is the Fear and Greed Index updated?
A. The index is updated daily, providing real-time insights into shifting market sentiment.
Q. Is the Fear and Greed Index reliable for all markets?
A. Yes, the index is relevant for markets globally, though it is primarily focused on the US market. The emotional patterns it tracks are universal, making it a valuable tool for understanding investor sentiment worldwide.
Q. What should investors do when the index shows extreme fear?
A. When the index shows extreme fear, it may be an opportunity to buy undervalued assets. However, it’s important to assess the broader economic conditions before making any decisions.
Conclusion
In a world driven by emotions, the Fear and Greed Index stands as a beacon for those seeking clarity. Over the past 3 years, it has provided crucial insights into the collective mindset of the market, helping investors navigate the highs and lows of financial markets. By understanding and applying the lessons from this index, you can take control of your investments, making decisions based on rational analysis rather than being swayed by emotional extremes.
Image Sources:
Also Read:

